


Private market fundraising continues to be one of the most watched indicators in the fund finance market, with the assumption that it drives origination volume. Over the past five years, fundraising has moved from the upper left of the chart to the lower right, while fund finance lender commitments traveled in the opposite direction. This leads to the conclusion that fund finance market growth also relies These indicators point to room for material growth in fund finance originations in 2026.
A Pond and a Bucket
Bank lender engagement is a primary driver of fund finance origination volume.
Fund finance origination volume, in a way, is like measuring how much water you can scoop out of a pond with a bucket in a year. The pond—4,190 funds raised in 2025 for $1.3 trillion, according to Preqin—compares with our new money subscription facility originations of roughly 300 facilities for $43 billion in the U.S. When the fund finance outlook framed around the water level in the pond (which also happens to be the most easily accessible data), it overlooks a key variable.
Instead, I focus to the size of the bucket—how much banks are able and willing to finance. Now, at the outset I admit the pond and the bucket analogy is incomplete. Fund finance origination is also constrained by the proportion of bankable funds in a year, referring to funds with known sponsors, institutional LPs, and diversified borrowing bases. But, as bank engagement rises, the willingness to finance newer or smaller sponsors, first-time funds, concentrated borrowing bases, and otherwise non-conforming transactions also increase. Bank engagement continues to constitute a controlling variable.
Exhibit 1: Fund Finance Origination Has Defied the Downtrend in Global Fundraising *
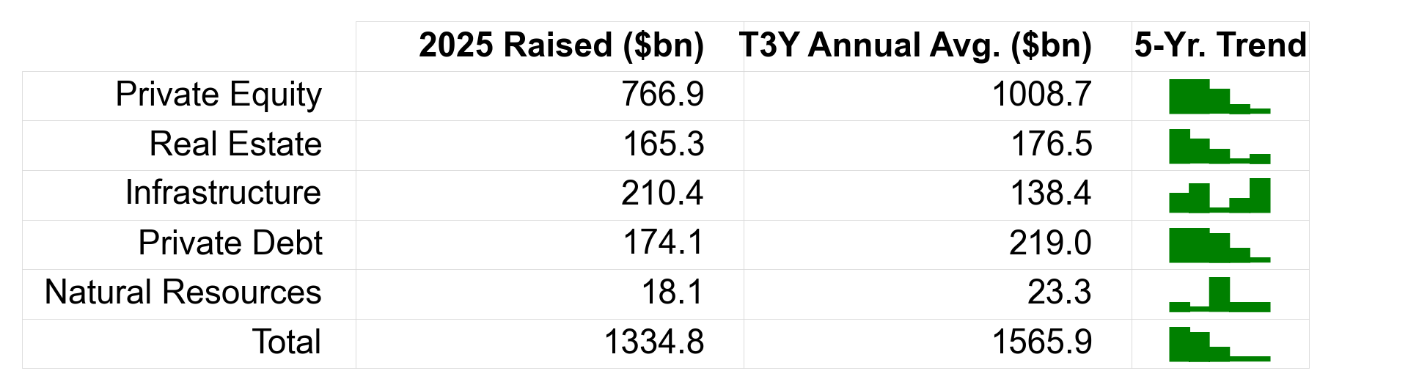
* Source: Preqin and Cadwalader, Wickersham & Taft LLP.
Toward Measuring Bank Engagement in Fund Finance
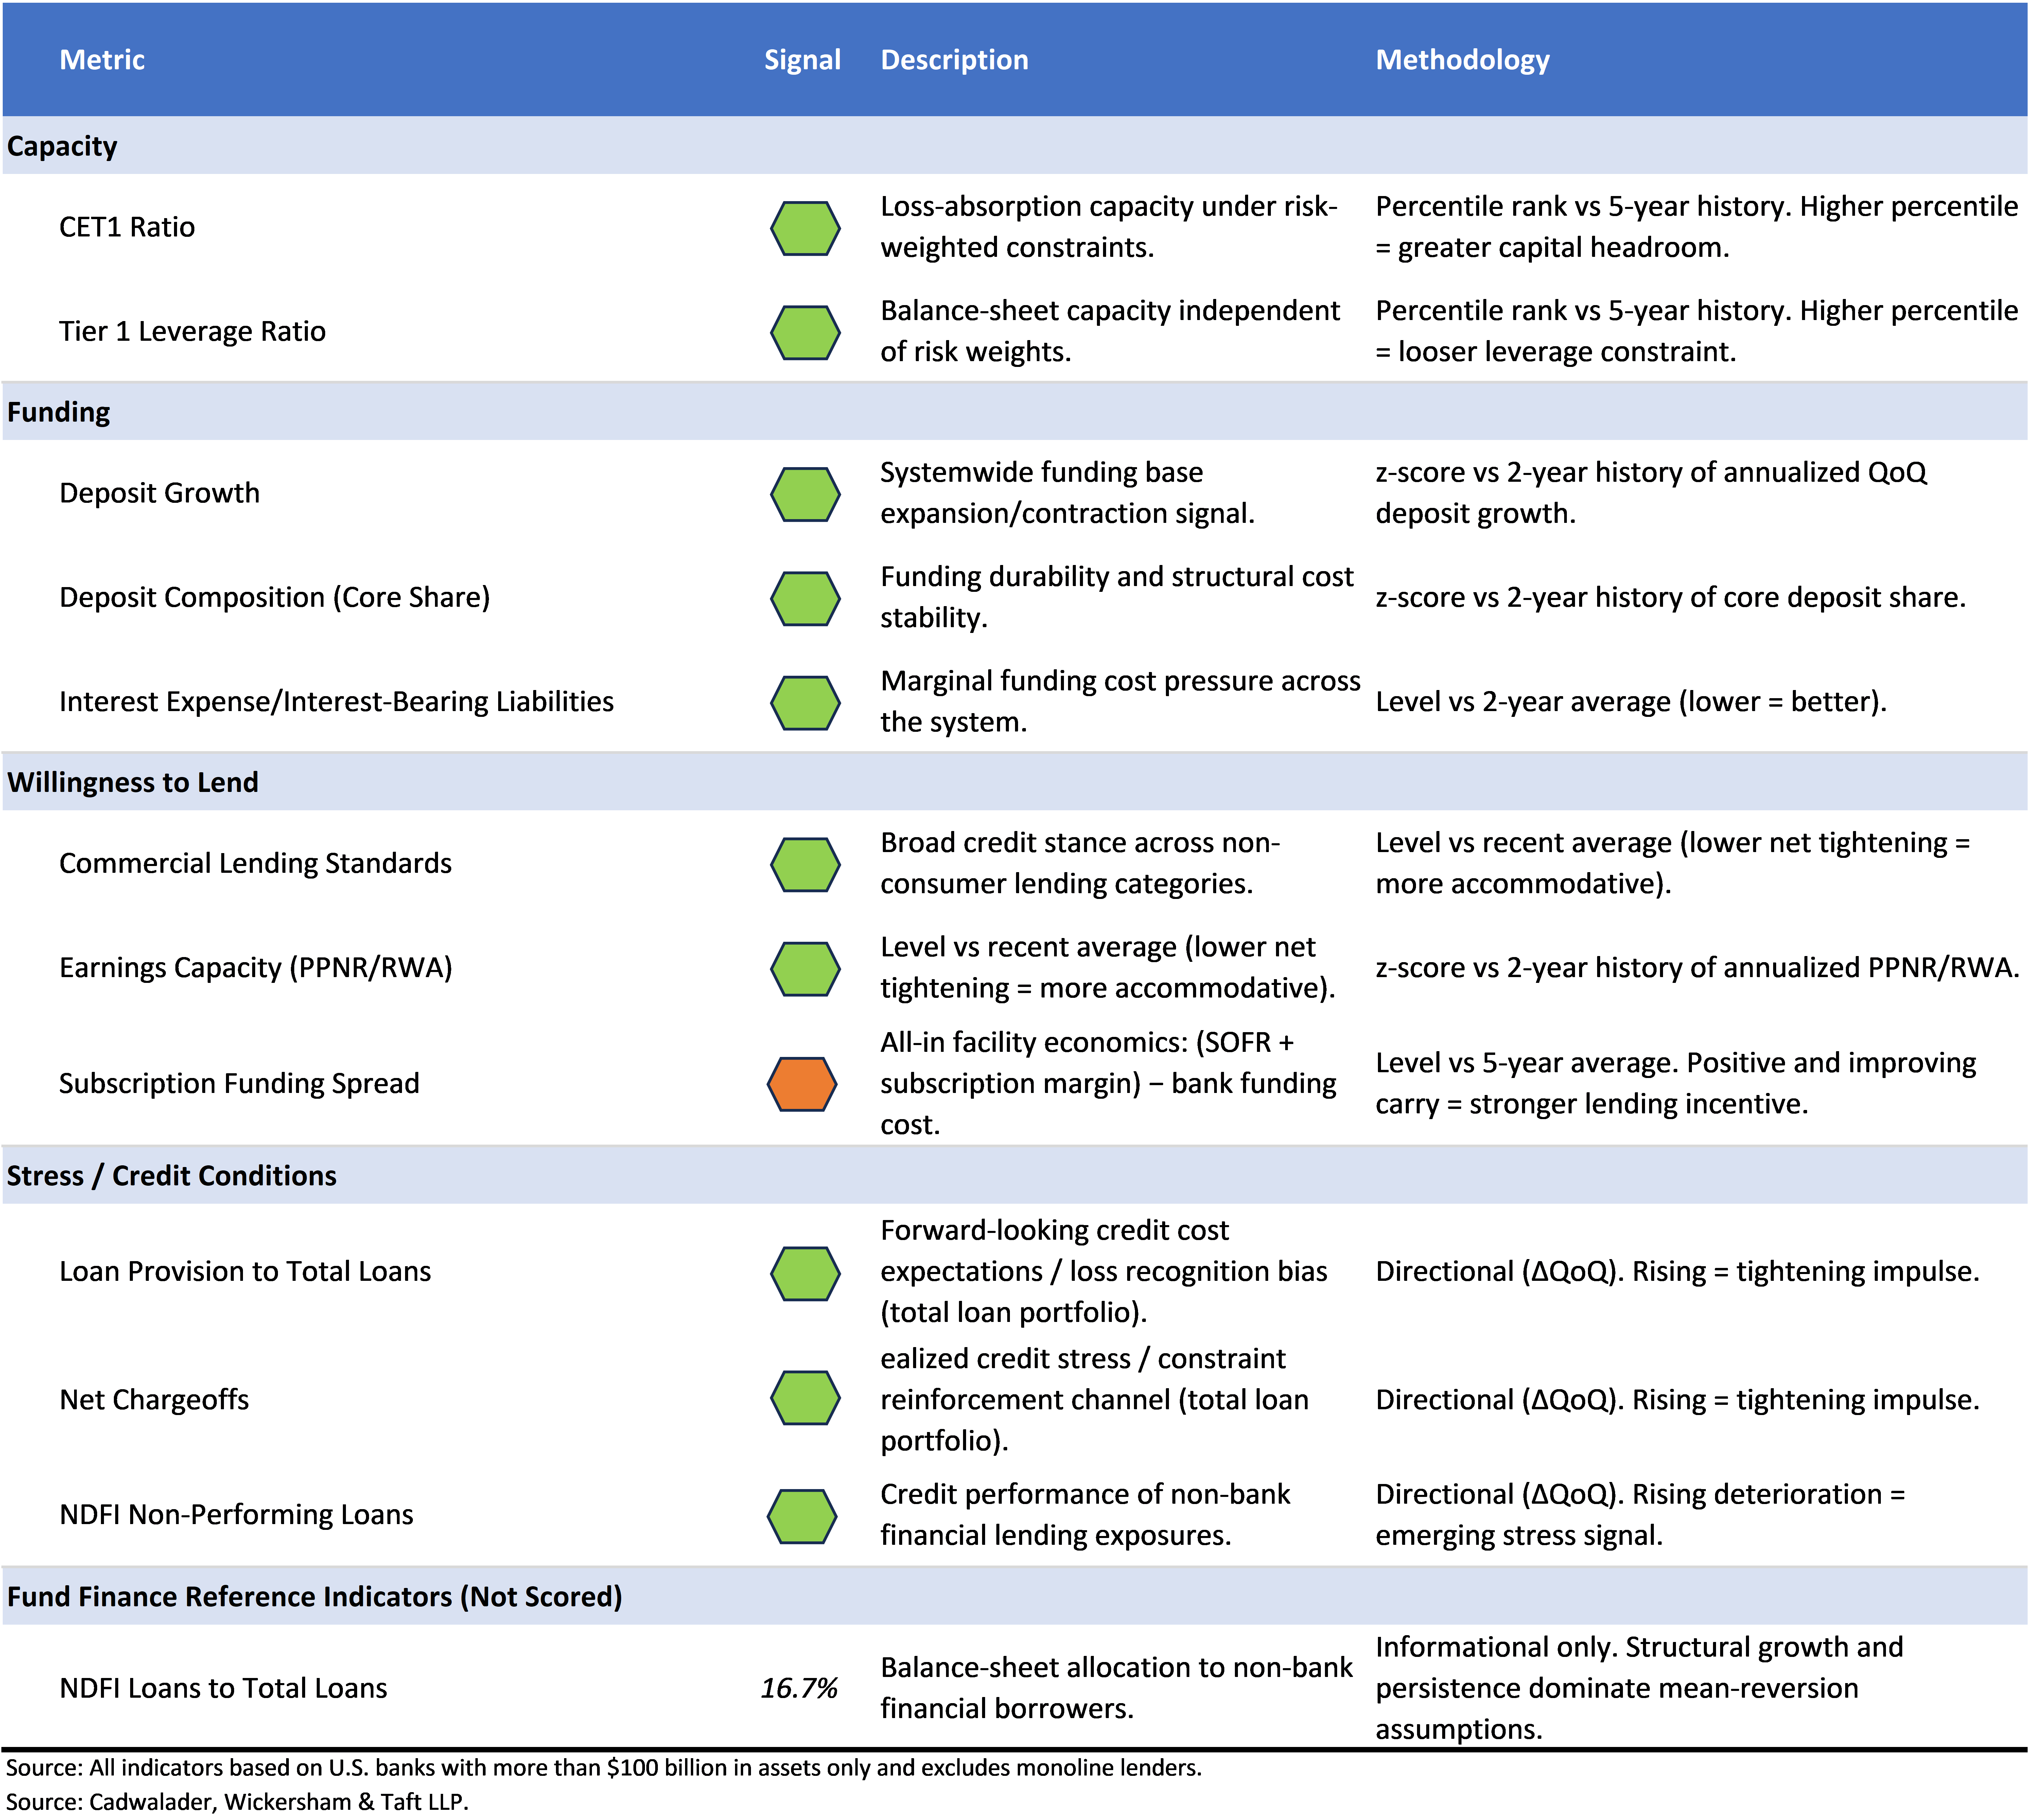
To fill out the bank side of the origination outlook, I aggregate lending capacity and credit conditions for the 29 U.S. banks with total assets above $100 billion (excluding monoline lenders like credit card originators). The indicators track balance-sheet constraints, funding costs, credit stance, and loss dynamics. Together, these measure lender capacity and willingness to engage in fund finance origination. As Exhibit 2 illustrates, these conditions, on the whole support growth in 2026.
The aggregate CET1 ratio (core capital) for our sample stood at 14.3% and the Tier 1 leverage ratio at 8.68% at the end Q4, both high relative to their five-year ranges. Funding conditions improved during the quarter, with significant deposit growth and core deposits (stable, low-cost funding) holding above the two-year trend at 79.8% of the deposit base. Interest expense moved lower to 2.09% of interest-bearing liabilities. Credit conditions also became less restrictive, as net tightening in commercial lending standards eased during the quarter based on a composite of non-consumer loan categories. Earnings capacity (PPNR/RWA) remained stable near 3.14%, while provision and charge-off rates drifted modestly lower.
Subscription facility economics continue to trend lower, based on a measure of the current subscription plus SOFR less bank funding costs. While this subscription funding spread measure has been trending lower since 2023, it still holds well above the 2019-2022 experience when fund finance originations experienced material growth.
Exhibit 2: Bank Fundamentals Support Fund Finance Origination Growth in 2026
Conclusion
In aggregate, large bank balance sheets retain ample lending capacity to expand lending in 2026, with fund finance continuing to screen well as a relationship product with ancillary fee income, relative value, and clean credit performance. With this capacity comes increased competition between lenders, fewer loan participation opportunities, and less immediate need for outside lending capital, all of which are already evident. At the same time, a bank-focused framework underscores why reserving off-balance sheet capacity through securitization, term loans, and SRT builds in countercyclical flexibility for the future to originate when industry conditions tighten.